Map Relief And Elevation
Height, Contours, Spot Heights
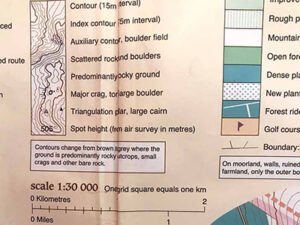
We will look at some ways that the mountains and landscape can be depicted on maps. Understanding maps is a fundamental skill. Spend some time examining the contours on a map. Map makers use colour, height, contour lines and a huge selection of symbols to give us useful information that allows us to understand the map and how it relates to the landscape it represents.
What is Relief and Elevation On A Map?
What is a mountain?
What is water?
What is a path?
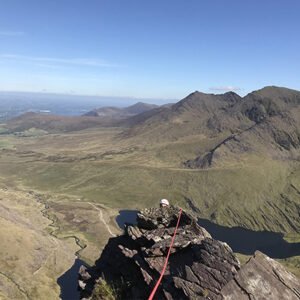
We all can understand this photo
A Shared Language
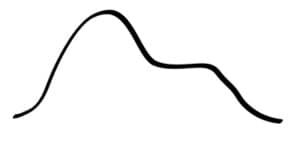
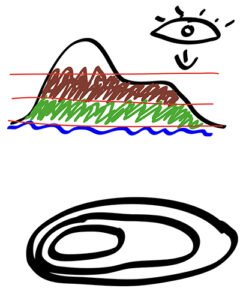
What’s the image in Fig 2? A Mountain? We all might understand what that is as we have drawn something similiar as children.
Developing A Key
Now what?
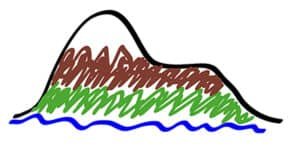
It is a mountain with:
Water?
Vegetation?
Rock?
Snow?
We all understand that because I have told you or you knew already.
We don’t need any specialist knowledge
We are beginning to develop a shared set of terms and icons: A Key
3D to 2D
Luggala: How do we represent this on a map?
Can we draw this profile on a map?
We have only one viewpoint.
We are looking at the mountain from ground level
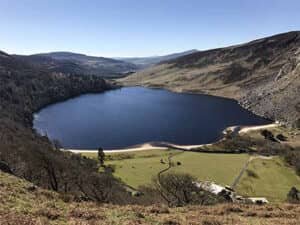
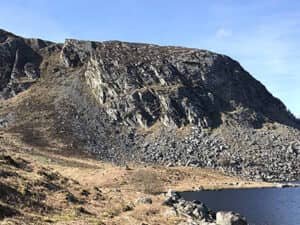
Lough Tay: How do we represent this on a map?
We are looking down on the lake
We can see the shoreline
The shoreline represents a level line that
intersects the landscape.
We could see it as a ‘Contour Line’.
Developing Contours
How do we represent 3D landscape on a flat piece of paper?
Using Lough Tay as an example; We draw evenly spaced imaginary lines through the mountain:
- Each line represents an agreed height
When we draw and view the lines from above we see where the lines intersect the volume of the mountain:
These lines are called ‘Contour Lines’
The relief of the natural landscape is represented on a map by a series of these contour lines. 3D into 2D
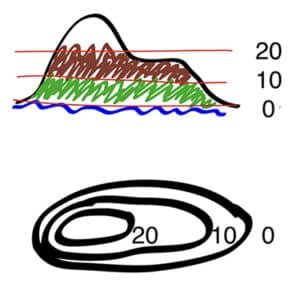
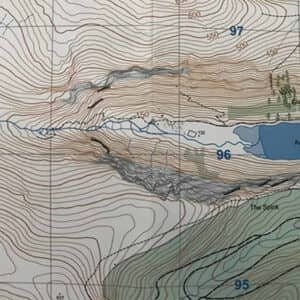
If we space the lines out evenly at agreed intervals, we can tell what the ‘shape’ of the landscape is at those heights
By observing the relationship between the contour lines we can understand more detail about the landscape
The closer the contour lines are the more sudden the height gain is and therefore the landscape is steeper
The wider the space between the contour lines are indicate a more gentle the slope
Looking at just the contours we can tell that it would be easier to walk up the mountain on the right side. The left side is steeper
Adding Context
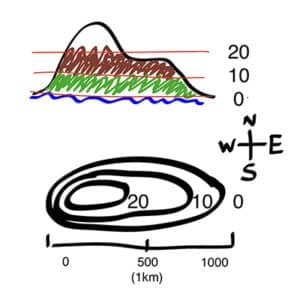
To really help us plan and navigate our way about this map we need more information
How big is this mountain?
Will it take all day to walk up there?
A scale is useful.
What direction are we traveling?
All these things help us to understand the ‘Relief’ of the landscape.
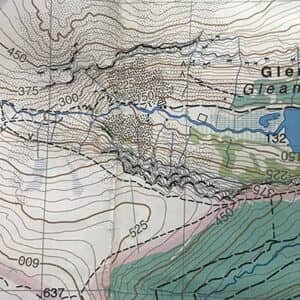
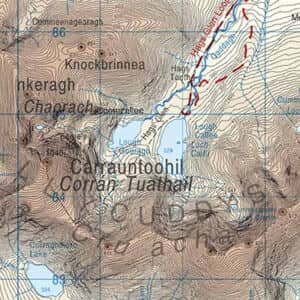
Adding More Detail
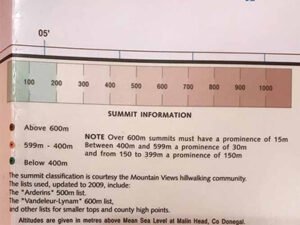
Above we see summit information (altitude) indicated by numbers and colours
Adding More Detail
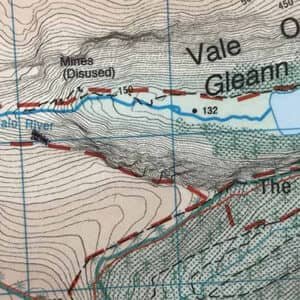
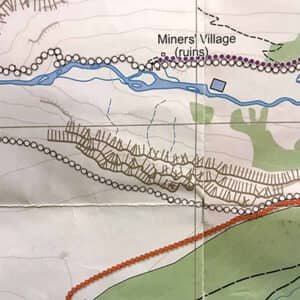
Map Of Photo
Now you can sesame of the contours that represent our original photo